Research Resources
Add to your "writing a research paper" course guide the information presented to the right. Once you have looked at the basics of what is required for this section of the paper, use one of the provided research papers (from the beginning of the year) to note the strengths of a GOOD materials and methods section.
The information shown below, should guide you in writing your own materials and methods section within your group.
Rubric – Flytrap Hydration Research Project – Materials & Methods
- Description of experimental design is detailed and ( _/8)
- Enough detail that another group could exactly copy your work
- Pay specific attention to measurement methods and types of materials
- Too much detail can obscure what you did!
- All materials used in the procedure are included in the description of the design
- ( _/8)
- No missing steps or materials
- The description is written in prose, past tense, without identifying pronouns.
- ( _/4)
- Prose means paragraph-form
- Past tense means all verbs occurred in the past
- Identifying pronouns include “I” or “we”
Total: ( _/20)
Note: The purpose of the Materials & Methods section is to communicate, in great detail, the steps of your experimental procedure, such that your reader (if they so choose) could replicate your experiment EXACTLY and have a reasonable chance of obtaining the same results. There is a fine line, however, between too much detail and not enough… It might be worth your time to read the materials & methods sections for other research papers (perhaps the research you cited in your Introduction) to get an idea of the level of detail that is typical for this section of a scientific paper…
Rubric – Flytrap Hydration Research Project – Results
- Prose description of results (no interpretation) ( /4)
- Results of experiment are presented with no inferences or conclusion
- Organized presentation of data ( _/6)
- Proper type of graph with informative labels (title, axes, key, etc.)
- Graph compares the appropriate mean +/- SD data
- Graph is referenced within the prose description of the results
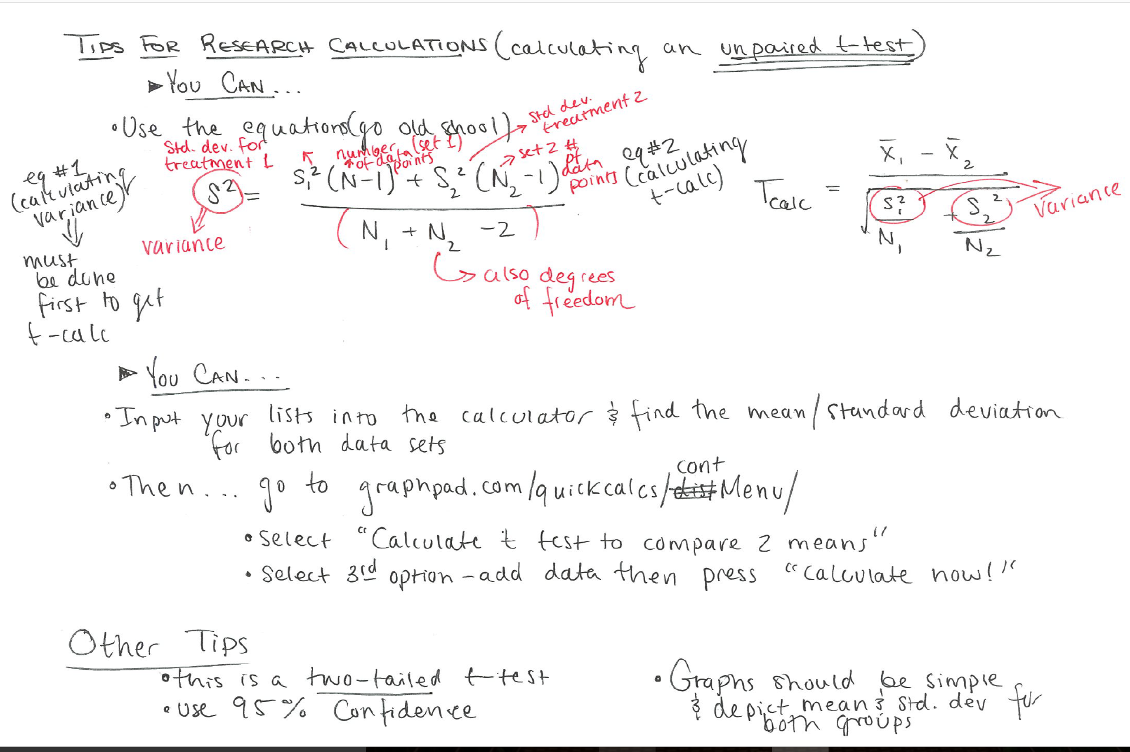
- Statistical analysis of data ( _/10)
- Mean +/- SD values are included in prose, as well as in graph
- All data has appropriate labels/units
- The appropriate statistical test was performed
- The results of the statistical test were clearly presented
- Calculated value(s)
- Critical value(s)
- Total: ( _/20)
- Note: Remember that the results section is meant to communicate exactly what happened in the experiment and should include nothing regarding your ideas about WHY it may have happened. You will bias your reader toward a particular outcome if you interpret the results for them. There is a section of the paper where personal interpretation is appropriate, but this is called the “conclusion” and it shows up later in your paper. In the results section, state only what actually occurred. The one exception to this is your presentation of your statistical test. With this, you must ‘interpret’ the outcome, but only to the extent that you say whether the differences were meaningful or not. In other words, you can say that there is (or is not) a statistically significant difference between two means in your experiment but you cannot say what you think this difference (or lack thereof) really means.
Rubric – Flytrap Hydration Research Project – Conclusion
- Restate hypothesis ( /2)
- Accept/Reject hypothesis ( /2)
- Support conclusion with data ( /8)
- Restate means +/- standard deviations
- Restate all appropriate data from statistical test
- Discuss meaning of data (put results in context of “null hypothesis”)
- Reference previous research (to put your results into context) ( /5)
- At least two scientific papers or journal articles (primary sources)
- Discuss meaningful sources of error (at least two) ( /4)
- Discuss areas for further research (at least two) ( /4)
- Attached “References” page, MLA or APA format ( _/5)
- At least twelve separate references (including those used in the intro)
- 3 general background (secondary sources)
- 5 scientific papers (primary sources) Total: ( _/30)
Note: The purpose of the Conclusion is to explain what the results of your experiment tell you about the question that you attempted to answer. This means readdressing your hypothesis and stating whether the data support or do not support this hypothesis. You will also need to restate the summary statistics themselves (mean +/- standard deviation) as well as the results of your statistical test. This time, however, you should explain what you think the summary statistics and the results of your statistical test actually mean. In other words, especially after addressing sources of error, you may decide that even a result that appears to be a statistically significant one may still be a “fluke”. Or you may decide that an effect may actually be involved, even though the data perhaps didn’t support that conclusion. Here you discuss what actually happened, what it all means to you, and what it means in the context of other research in the area. So, as in the Introduction, you will need citations (a minimum of 2) and a “References” page of scientific journal articles that help tell the story of where research in this area stands… as well as where it may be headed.
© Copyright Creek Honors Bio